Part 1: FERPA/HIPAA
My scores changed a little between the pre- and post-tests. There were a few things I didn’t really know about like how long schools had to maintain student records and school nurse records. Much of the privacy requirements, such as posting of grades and student information, I was already aware of. At my school, we tend to be very cautious about what we put in writing when discussing student information; for instance, if we have questions about a particular student and want to discuss those with other teachers and/or counselors, we try not to email our questions but go directly to the teachers/counselors. This is not always possible, but when we can do it, it allows us not to have a “paper trail” that can be FOIA’ed and used later. Plus it gives the extra security for students that information about them isn’t floating around in teachers’ in-boxes.
Part 2: School Data
My district uses PowerSchool to house our demographics, attendance, and class performance data, so I used it to conduct my queries. The first data set I queried was ethnicity makeup by grade at my school. East Lansing is quite diverse and it’s interesting to see the different people groups in each grade. This information is also useful when setting up course sections so that students are evenly distributed so that each section has a diverse make up of students to allow for better discussion and learning.

The next report I ran was an MME Social Studies Snapshot for Economically Disadvantaged Students for 2012-2013. The snapshot compared disadvantage to not-disadvantaged students, and the results are quite striking. There are very few to no economically disadvantaged students performing at Level 1 (Advanced); fewer disadvantaged students are Proficient as compared to not disadvantaged students. There are many economically disadvantaged students who are partially proficient, and there are more who are not proficient compared to not disadvantaged students. Just the information in the snapshot alone is very telling. I would be curious to look at the individual questions to see how students performed and discuss as a department what we can do to get our disadvantaged students on par with our not-disadvantaged students.

Part 3: Rubrics
I used the rubric below with a project called “Create Your Own Business.” The project asks students to apply material they have learned from our first unit of study in Economics to a business they create. In the project students answer the three basic economic questions of what to produce, how to produce, and for whom to produce; they determine their factors of production (land, labor, and capital goods); they explain the opportunity costs associated with their business/product; and they examine alternative goods consumers could choose, and explain how they will compete with similar businesses.
The rubric helps me assess students’ work in categories of:
- thoroughness (did students complete all the requirements)
- application of economics concepts and use of economics vocabulary
- business organization (did students show their understanding of the different types of business organizations)
- economic questions and factors of production (did students answer the economic questions completely and explain all their factors of production in a measurable way)
- opportunity costs/trade offs (did students demonstrate an understanding of these concepts as applied to their business)
- creativity (did students think outside the box and come up with a unique idea)
- organization (did students have a well organized, easy to understand plan)
Because the rubric is based on measurable objectives, I can easily check off students’ work and determine if they completed all the requirements and whether or not they were complete in their explanation and understanding of the material. I have used a different rubric in the past with this project, but most recently used the one below and found it to be more useful in assessing students’ work because I was looking for measurable details. It also allowed me to provide students with great feedback that explained how they were assessed (and they saw the rubric ahead of time so they knew how they would be assessed).

Part 4: My Own Perception/Achievement Data
Because I’m not teaching this year, I am using an old pretest quiz I gave to students in Moodle. The quiz assessed students’ understanding of economics concepts we covered in the class, and I gave it at the beginning of the semester. Below is a screenshot of the first five questions on the quiz; the full pretest is 40 questions. As far as the uses for Moodle, I used it ALL THE TIME last year when teaching my hybrid class. (I also used it prior to that for quizzes because it makes grading so easy!) I used Moodle specifically for online discussions, journal entries, and quizzes. Students were only “in class” 3 days a week, so all of my assignments were posted on my class website and/or hosted in Moodle. My students loved that they received immediate feedback on quizzes and short assignments, plus I allowed them to retake the quiz in order to master the material. When I graded their work, I would download the final scores as an excel file and input them into the grade book. Then I would look at the responses and statistics section of the quiz in Moodle to see which questions students tended to struggle with so I would know what I needed to review and reteach before moving on. I loved that all the data was right there in the system so that I didn’t have to aggregate it on my own. It made it easy to see what lessons went really well and which ones needed some more attention. When I go back to the classroom I intend to use Moodle again, as it was such a helpful tool! My students seemed to enjoy using it too!

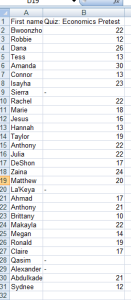
Part 5: Spreadsheet/Graph of My Data
Above is a spreadsheet of the pretest results, below is one of pretest and final exam results, along with a graph from excel comparing the two. As mentioned above, I typically would use the graphs from Moodle, but I no longer have my student data in Moodle because I unenrolled them, anticipating that I would be teaching again this school year. I did, and plan to, however, frequently use the graphs in Moodle to guide my teaching.


